Thursday, November 16, 2006

r.drain to determine best route between points

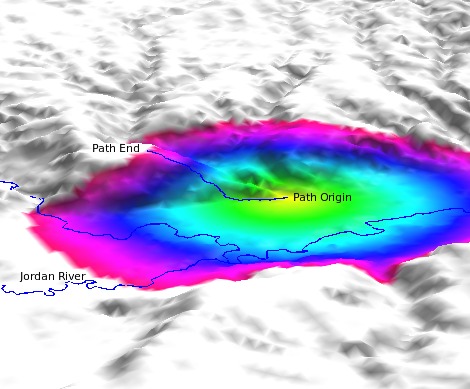
Thanks doktoreas for the idea and help. This is neat. The path is defined by the line, and the destination is the same as that used to create the colored catchment area which shows where all you can get to with the same effort as following this path! Very Cool!

Wednesday, November 15, 2006

r.walk

The grey shaded area represents the arable land required to sustain a population of 4000 people if you use euclidean distance. The freaky colored stuff is the result of r.walk with a max value being the edge of the above results. I plan to use the results of r.walk analysis instead of euclidean distance, as it seems more feasible. r.walk is my friend!

Tuesday, November 14, 2006

catchment with rivers

I want everything to the west of the river to be excluded from the catchment (the shaded areas)

Ok, first of all, PLEASE don't laugh at my improper use of flowcharting symbols! :s I can't remember what the correct ones are and I just can't be arsed to look it up. Now, what I am doing is this... I am analyzing a binary raster row by row. everything on the left side of a wall (or river in this case) I want to be set to -999.99. So this works fine unless the river meanders. so I figured that out. the problem comes when the river runs straight left to right (adjacent cells in the same row). I have the logic worked out for it but only if there is no more than 2 adjacent cells in a row... after that it falls apart.... any ideas or suggestions?

Monday, November 06, 2006

some initial results